New manufacturing data has revealed which industries and nations are leading the way in the post-pandemic economic recovery – and the tactics they’re using to beat supply chain disruption.
The Manufacturers Health Check report shows SMEs in the UK, New Zealand and Australia were forced to hold record levels of stock in Q3 2022 – a response to billowing international lead times.
While this shift in stock strategy has let firms deliver to their customers within reasonable time frames, it has also fundamentally altered their financial performance.
Gross Margin Return on Inventory (GMROI), a profitability metric that accounts for unsold inventory, has now dropped in all three countries as manufacturers abandon the Just In Time business model for the more costly Just In Case approach.
https://www.youtube.com/embed/wMsVMIne4TE?start=87
Our research
By extracting anonymised data from the Unleashed cloud inventory management software platform we were able to find which countries and sectors have seen the biggest changes. We did this by analysing four key metrics:
- The average value of total stock on hand – reflecting the volume of goods held (plus impacts from inflation).
- GMROI.
- Fulfilment days – the period between receiving and fulfilling an order.
- The average price paid for goods purchased.
How UK manufacturers have fared
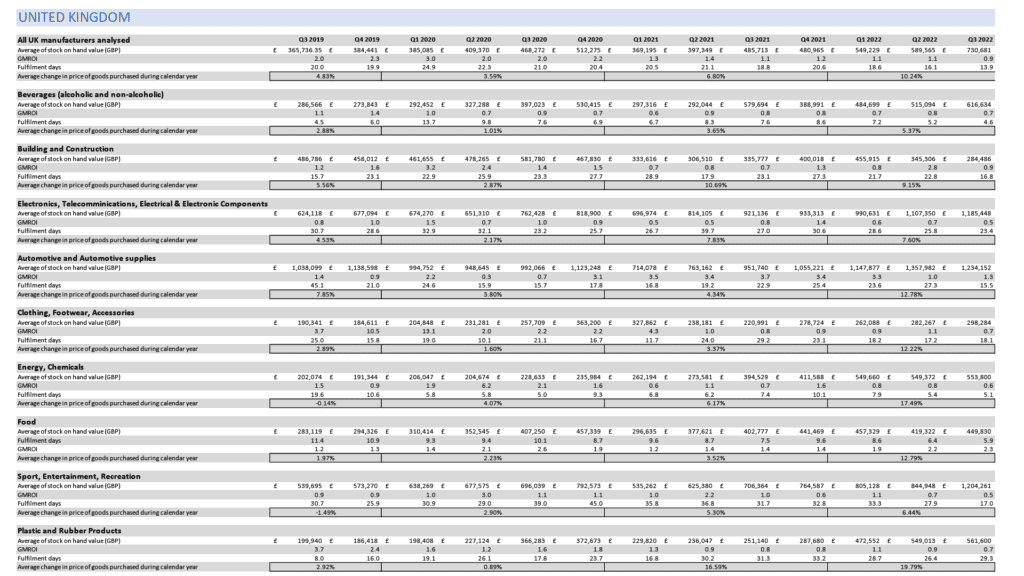
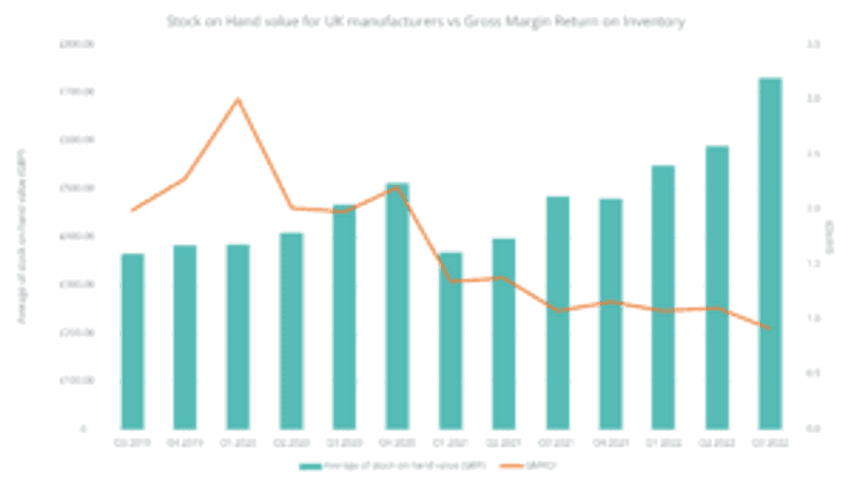
UK manufacturers have seen the value of stock on hand jump 99.7%, from £365,736 in Q3 2019 to £730,681 in Q3 2022. In the same period GMROI dropped from 2 to 0.9 and fulfilment times fell, from 20 days to around two weeks.
In 2022 alone UK manufacturers have seen a 10.24% increase in the average price paid for the same group of goods – the highest of all the regions in this report.
How Australian manufacturers have fared
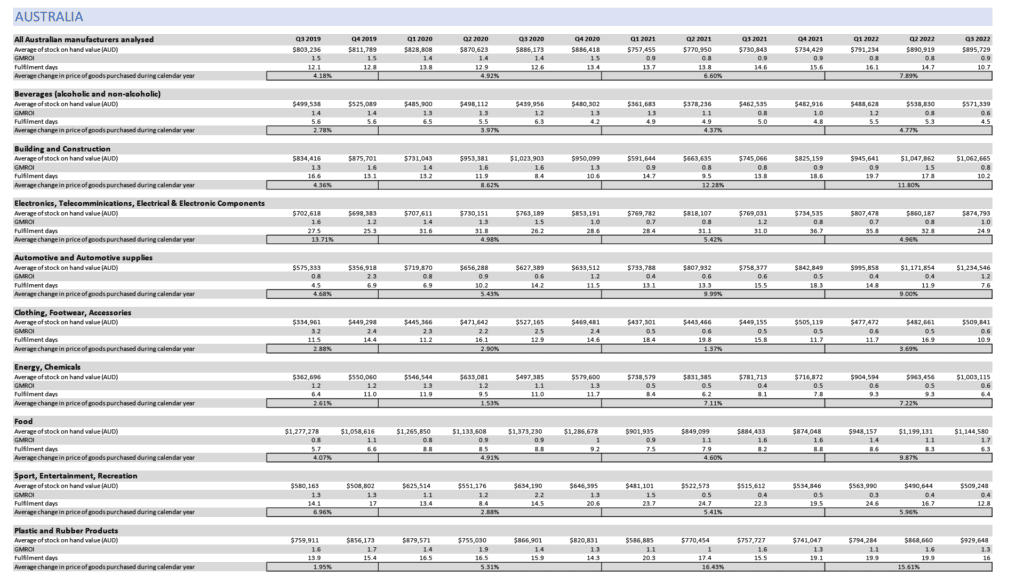
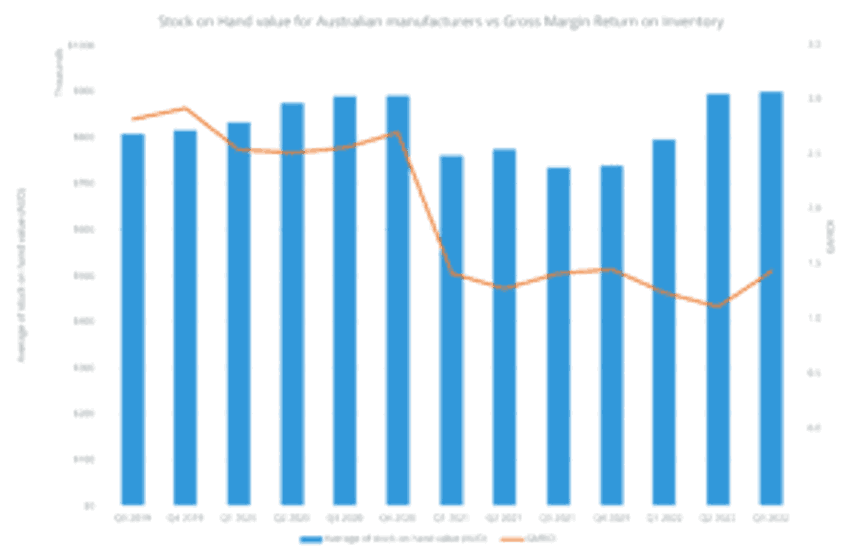
In Australia, the value of stock on hand has risen modestly since the pandemic – from AU$803,236 in Q3 2019 to AU$895,729 in Q3 2022 (up 11.52%). However GMROI fell from 1.5 to 0.9. Fulfilment times dropped too by just under a day and a half, from 12.1 to 10.7 days on average.
In 2022 Australian manufacturers have experienced a 7.89% increase in the average price paid for the same group of goods.
How New Zealand manufacturers have fared
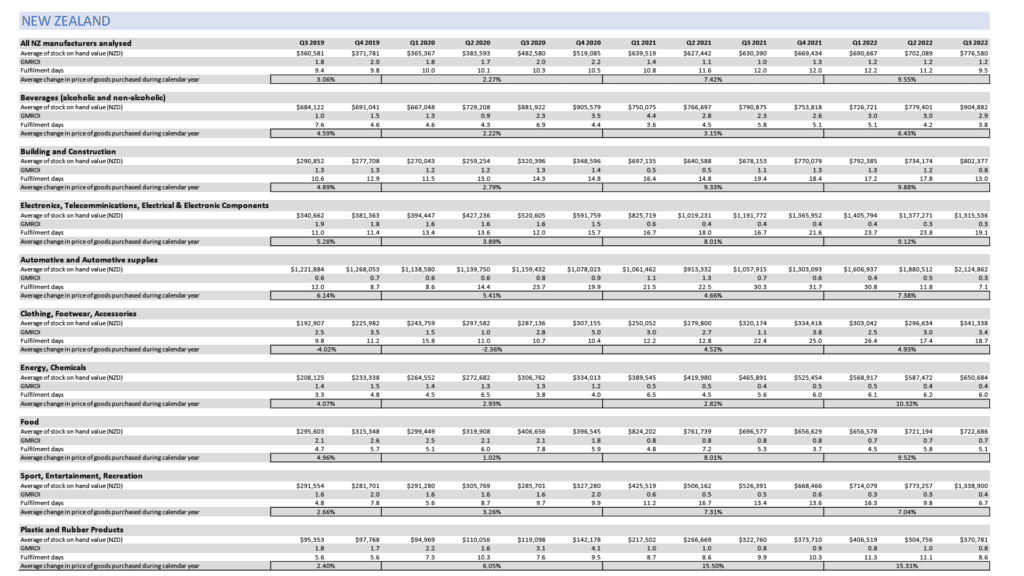
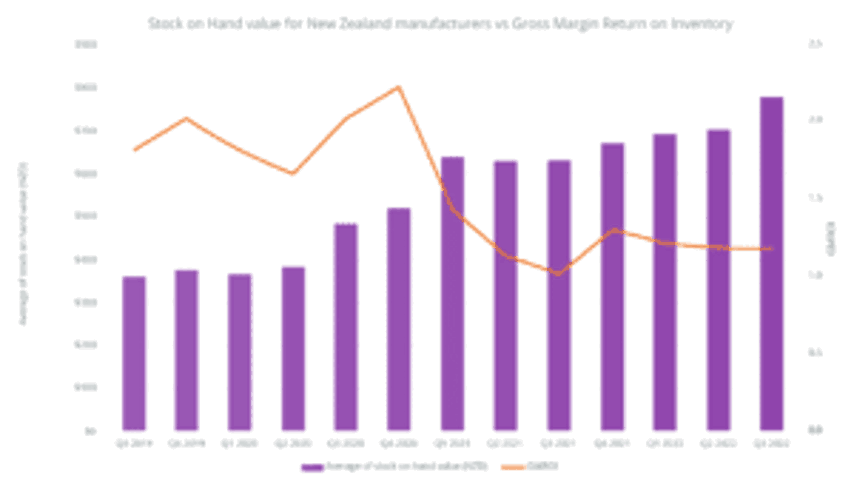
Unleashed’s data shows that manufacturers in New Zealand saw the value of stock on hand more than double, from NZ$360,581 in Q3 2019 to NZ$776,580 in Q3 2022 (up 115.3%), with GMROI falling from 1.8 to 1.2. Fulfilment times have reverted to pre-pandemic levels of around nine-and-a-half days, after peaking at just over 12 at the start of this year.
In 2022 New Zealand manufacturers have experienced a 9.55% increase in the average price paid for the same group of goods.
Sector performance for UK manufacturers
Of course, the overall figures only tell part of the story. We then looked at different sub-sectors for each territory to see which are performing best and worst against these metrics.
For a full quarter-by-quarter breakdown, click the lightbox image below.
Full UK Data: Click to Enlarge
The highest percentage change in the average value of stock on hand between Q3 2019 and Q3 this year was the plastic and rubber sector – with an average increase of 180%. This was followed by energy and chemicals (up 174%), and the sports and entertainment sector which recorded an average increase of 123%.
In fact, all industries featured in this research were holding an increased value of stock this year compared to 2019, with the exception of manufacturers in the building and construction sector.
Percentage change in stock on hand value, UK (Q3 2019 v Q3 2022)
|
Plastic and Rubber Products |
180.88% |
|---|---|
|
Energy, Chemicals |
174.06% |
|
Sport, Entertainment, Recreation |
123.14% |
|
Beverages (alcoholic and non-alcoholic) |
115.18% |
|
Electronics, telecommunications, Electrical & Electronic components |
89.94% |
|
Food |
58.88% |
|
Clothing, Footwear, Accessories |
56.71% |
|
Automotive and Automotive supplies |
18.89% |
|
Building and construction |
-41.56% |
Gross Margin Return On Inventory (GMROI) is an inventory profitability evaluation ratio that analyses a firm's ability to turn inventory into cash above the cost of the inventory. It's clear that firms are feeling the impact of holding more stock, with the majority of firms seeing a drop in overall profitability when looking at this metric specifically.
All sectors in the UK saw a decline in overall GMROI with the exception of the food sector which was up 93%. The clothing sector (down 81.8%), plastic and rubber products (down 81%) and energy and chemicals (down 62%) saw the biggest declines.
Percentage change in GMROI, UK (Q3 2019 v Q3 2022)
|
Food |
93.69% |
|---|---|
|
Automotive and Automotive supplies |
-7.22% |
|
Building and Construction |
-25.00% |
|
Beverages (alcoholic and non-alcoholic) |
-36.73% |
|
Electronics, telecommunications, Electrical & Electronic components |
-37.50% |
|
Sport, Entertainment, Recreation |
-46.28% |
|
Energy, Chemicals |
-61.97% |
|
Plastic and Rubber Products |
-80.99% |
|
Clothing, Footwear, Accessories |
-81.79% |
Plastics and rubber recorded the highest average fulfilment time. In Q3 2022, the sector recorded an average of 29.3 days to fulfil and order – well above the UK average of 13.9 days.
However, when looking at percentage change, the majority of the nine industries featured in this research have been successful in cutting fulfilment times over the past three years, with energy and chemicals (down 74.1%), automotive (down 65.6%) and food (down 48%) making the biggest reductions.
Percentage change in fulfilment days, UK (Q3 2019 v Q3 2022)
|
Plastic and Rubber Products |
266.81% |
|---|---|
|
Building and Construction |
6.96% |
|
Beverages (alcoholic and non-alcoholic) |
2.45% |
|
Electronics, telecommunications, Electrical & Electronic components |
-23.99% |
|
Clothing, Footwear, Accessories |
-27.77% |
|
Sport, Entertainment, Recreation |
-44.69% |
|
Food |
-48.64% |
|
Automotive and Automotive supplies |
-65.60% |
|
Energy, Chemicals |
-74.12% |
Sector performance for Australian manufacturers
In Australia, the percentage changes in the average stock on hand values were highest among the energy and chemicals, and automotive sectors. The average increase for stock on hand within the energy and chemicals sector was 176% between Q3 2019 and Q3 2022, and 114% in the automotive sector. This was followed by clothing, footwear and accessories, though at a significantly lower increase of 52.2%.
Full Australia Data: Click to Enlarge
Percentage change in stock on hand value, Aus (Q3 2019 v Q3 2022)
|
Energy, Chemicals |
176.57% |
|---|---|
|
Automotive and Automotive supplies |
114.58% |
|
Clothing, Footwear, Accessories |
52.21% |
|
Building and Construction |
27.35% |
|
Electronics, telecommunications, Electrical & Electronic components |
24.50% |
|
Plastic and Rubber Products |
22.34% |
|
Beverages (alcoholic and non-alcoholic) |
14.37% |
|
Food |
-10.39% |
|
Sport, Entertainment, Recreation |
-12.22% |
In the most recent chart of GMROI, for Q3 2022, the food sector and the automotive & automotive supplies sectors recorded the most impressive increases, up 112.5% and 45.8% respectively compared to 2019.
All other industries saw notable decreases in overall GMROI, with clothing, footwear and accessories seeing the biggest decline overall (down 80.3%), with beverages (down 53%) and energy and chemicals (47.5%) also experiencing significant downturns in GMROI.
Percentage change in GMROI, Aus (Q3 2019 v Q3 2022)
|
Food |
112.50% |
|---|---|
|
Automotive and Automotive supplies |
45.81% |
|
Plastic and Rubber Products |
-18.75% |
|
Electronics, telecommunications, Electrical & Electronic components |
-38.14% |
|
Building and Construction |
-41.53% |
|
Energy, Chemicals |
-47.52% |
|
Beverages (alcoholic and non-alcoholic) |
-53.01% |
|
Sport, Entertainment, Recreation |
-69.23% |
|
Clothing, Footwear, Accessories |
-80.28% |
When looking at percentage change in fulfilment times, five of the nine Australian industries featured in this research have been successful in cutting lead times over the past three years, with building and construction (down 38.6%) and beverages (down 19.6%) making the biggest reductions.
The automotive industry is most notably struggling to recover fulfilment times to pre-pandemic levels, up by more than two thirds (68.8%) on average compared to 2019.
Percentage change in fulfilment days, Aus (Q3 2019 v Q3 2022)
|
Building and Construction |
-38.55% |
|---|---|
|
Beverages (alcoholic and non-alcoholic) |
-19.64% |
|
Electronics, telecommunications, Electrical & Electronic components |
-9.61% |
|
Sport, Entertainment, Recreation |
-9.22% |
|
Clothing, Footwear, Accessories |
-4.97% |
|
Energy, Chemicals |
0.00% |
|
Food |
10.53% |
|
Plastic and Rubber Products |
15.11% |
|
Automotive and Automotive supplies |
68.79% |
Sector performance for New Zealand manufacturers
The New Zealand market saw the highest percentage change for average stock on hand values of any of the three countries analysed – significantly higher than either the UK or Australia.
The highest change in all three markets between Q3 2019 and Q3 2022 was within the New Zealand sports and entertainment sector, where average stock on hand value increased 359% in the period. In Q3 2022 this value stood at $1,338,900 – not the highest value, but the greatest increase.
The plastic and rubber products sector also reported an increase of over 288%, albeit from a small baseline figure, while electronics and telecommunications saw an increase of 286% over the three year period – all well over the national figure of 115.3%.
Full NZ Data: Click to Enlarge
Percentage change in stock on hand value, NZ (Q3 2019 v Q3 2022)
|
Sport, Entertainment, Recreation |
359.23% |
|---|---|
|
Plastic and Rubber Products |
288.85% |
|
Electronics, telecommunications, Electrical & Electronic components |
286.17% |
|
Energy, Chemicals |
212.64% |
|
Building and construction |
175.87% |
|
Food |
144.48% |
|
Clothing, Footwear, Accessories |
76.94% |
|
Automotive and Automotive supplies |
73.90% |
|
Beverages (alcoholic and non-alcoholic) |
32.27% |
Looking at Q3 figures for New Zealand GMROI, beverage manufacturers recorded the most impressive increase, up 176% compared to the same period in 2019. Clothing and footwear brands also saw an increase of more than a third (up 36%).
All other industries saw notable decreases in overall GMROI, with electronics seeing the biggest decline overall (down 83.5%), and sport, entertainment and recreation (down 78.7%) and energy and chemicals (down 73.4%) also experiencing significant downturns in GMROI.
Percentage change in GMROI, NZ (Q3 2019 v Q3 2022)
|
Beverages (alcoholic and non-alcoholic) |
175.96% |
|---|---|
|
Clothing, Footwear, Accessories |
36.00% |
|
Building and Construction |
-40.48% |
|
Automotive and Automotive supplies |
-50.79% |
|
Plastic and Rubber Products |
-57.92% |
|
Food |
-68.87% |
|
Energy, Chemicals |
-73.43% |
|
Sport, Entertainment, Recreation |
-78.66% |
|
Electronics, telecommunications, Electrical & Electronic components |
-83.51% |
Nationally the figures for fulfilment days for New Zealand were good – the national average was just 9.5 days in Q3 2022, compared to an average of 13.9 days in the UK and 10.7 days in Australia. Again it was the electronics and clothing sectors that recorded the longest fulfilment periods – of 19.1 and 18.7 days respectively.
However, when looking at percentage change, only two of the nine industries featured in this research have been successful in cutting lead times over the past three years, with Beverages (down 49.2%) and automotive (down 40.7%) making an overall reduction.
Percentage change in fulfilment days, NZ (Q3 2019 v Q3 2022)
|
Beverages (alcoholic and non-alcoholic) |
-49.22% |
|---|---|
|
Automotive and Automotive supplies |
-40.77% |
|
Food |
8.95% |
|
Building and Construction |
23.25% |
|
Sport, Entertainment, Recreation |
41.24% |
|
Plastic and Rubber Products |
55.03% |
|
Electronics, telecommunications, Electrical & Electronic components |
73.12% |
|
Energy, Chemicals |
80.31% |
|
Clothing, Footwear, Accessories |
91.13% |
Managing manufacturing businesses with the right tools
The dramatic shifts that manufacturers have experienced recently point to a greater need than ever to have the right reordering and inventory management software systems in place.
Systems like Unleashed give businesses the ability to track the value of stock on hand, view lead times, make intelligent stock replenishment decisions, and see which product lines are bringing the greatest profit margins – all critical parts of managing the challenging business conditions currently emerging.
About the data
We generated this report using anonymised data from a cohort of more than 4,500 Unleashed customers in the UK, NZ and Australia. Firms included were manufacturers across a broad range of industries that used Unleashed continuously from at least Q3 2019 to Q3 2022.
About Unleashed
Unleashed is cloud-based software that gives product businesses clarity and control across suppliers, production, inventory and sales. Founded in New Zealand in 2009 it was acquired by the UK’s Access Group in November 2020. With thousands of users in more than 80 countries, it’s one of the most respected names in inventory, manufacturing and product management software worldwide.
About GMROI
Gross Margin Return On Inventory (GMROI), also known as Gross Margin Return On Inventory Investment, is a profitability evaluation ratio that analyses a firm's ability to turn inventory into cash above the cost of the inventory. It is calculated by dividing gross margin by the average inventory cost.
- GMROI shows how much profit inventory sales produce after covering inventory costs.
- A higher GMROI is generally better, as it means each unit of inventory is generating a higher profit.
- GMROI can show substantial variance depending on market segmentation, period, type of product, and other factors.
