New manufacturing data reveals the small to medium manufacturing sector remains in recovery mode, with global performance largely mapping to local economic conditions.
According to the Unleashed Manufacturing Health Index – a new quarterly business health and performance index published today – UK manufacturers have responded well to current global challenges, while Australian manufacturers lag the northern hemisphere, despite overall improvement. New Zealand manufacturing, meanwhile, is at an historic inflection point, with stagnant performance in multiple sectors.

What is the Manufacturing Health Index – and what does it measure?
The Unleashed Manufacturing Health Index calibrates industry fitness on a scale of 0-100 for SME manufacturers throughout the United Kingdom, Australia and New Zealand.
Index figures are calculated from a combination of core performance metrics, including sales performance, purchasing and internal efficiency. Quarterly performance is then benchmarked against the nine previous quarters.
- Scores below 50 represent below average performance for each sector.
- Scores above 50 indicate above average performance
- Scores of zero or 100 represent historic minimum or maximum performance respectively.
The Q3 2023 index scores are based on more than 400,000 data points from 2,600 manufacturing firms using the Unleashed inventory management system.
Sector performance by country – United Kingdom
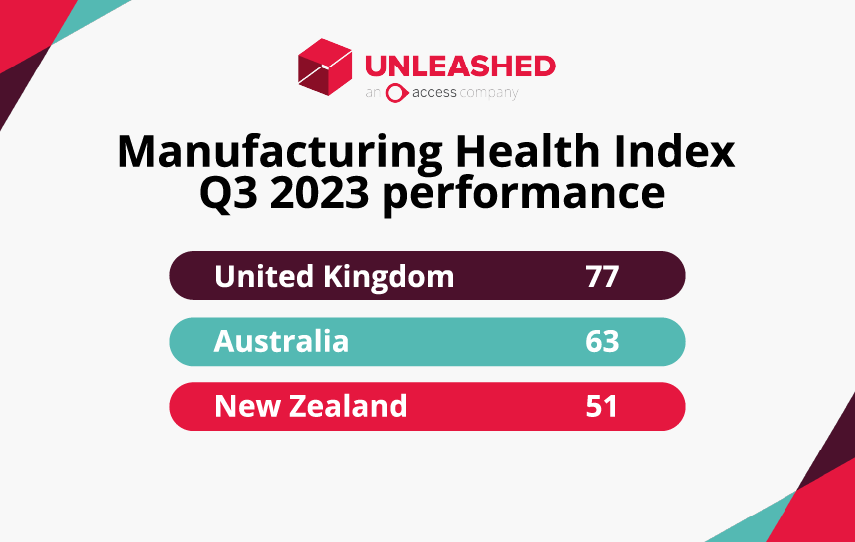
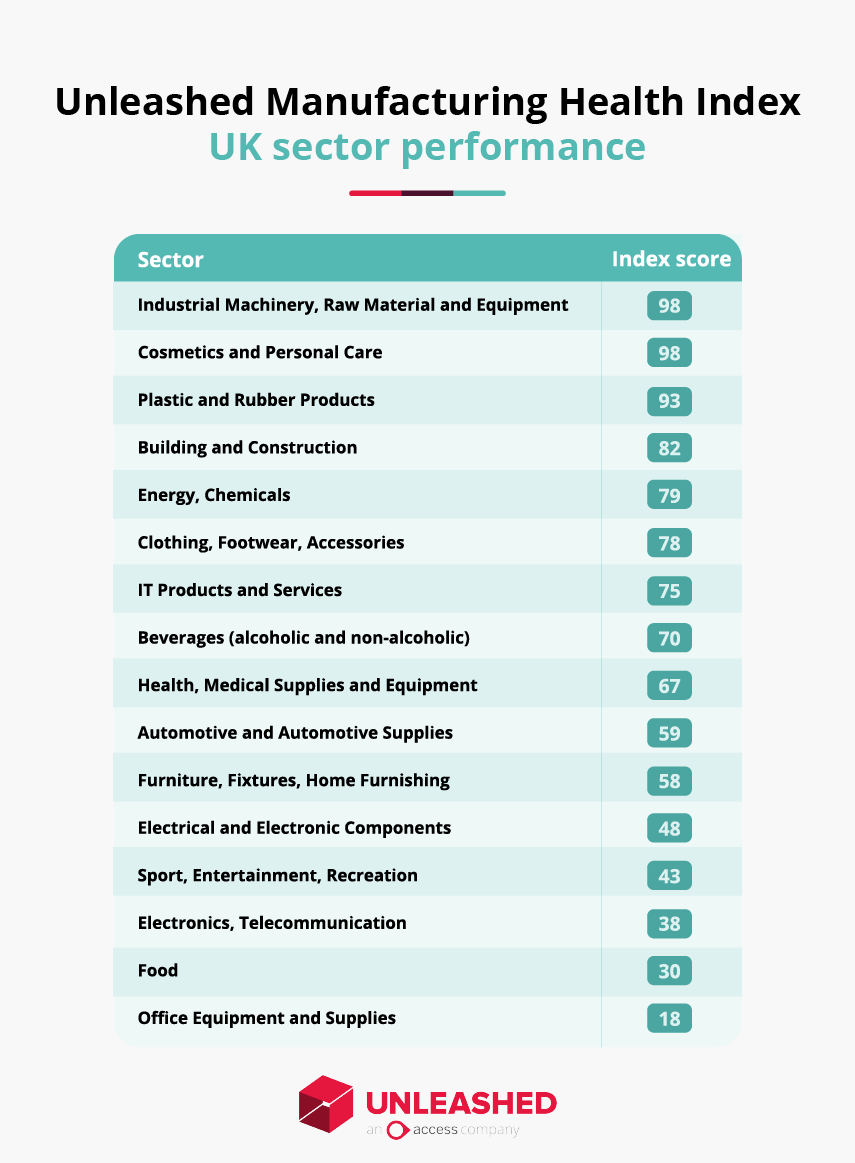
Overall, the UK manufacturing industry has returned a glowing health report for Q3, outpacing its Australian and New Zealand contemporaries with an average of 77 out of 100. These signs of growth have been spread relatively evenly across manufacturers, with 11 of the 16 industries studied measured above 50 health points.
The news reflects a manufacturing industry making considerable inroads, in spite of the high inflation and interest rates seen over the past year.
But October saw a sharp fall in inflation, while the Bank of England held interest rates at 5.25% the following month. So, while borrowing costs remain high, the news has at least provided a reprieve for industries with high borrowing such as Building and Construction, Raw Materials, and Energy, which should help to fuel recovery.

Up
- The UK Cosmetics & Personal Care industry has delivered on 2022 predictions of high business performance with an overall health score of 98, the first-equal highest score.
- Heavy industry is also leading the way with high scores seen in Industrial Machinery, Raw Material and Equipment; Plastics and Rubber; Building and Construction, and Energy and Chemicals.
- Clothing, Footwear, Accessories continues to trend upwards with a health score of 79, although it has dropped from its heights seen in early 2022.
Down
- As the once temporary transition to working from home during the pandemic becomes more of a permanent fixture for many businesses, Office Equipment and Supplies have felt the impact intimately this quarter. Faring worse than any other UK industry by a significant margin at 18,
While in regions like New Zealand, the Food and Beverage industries have tended to index to one another, there’s been a fork in the road for UK food manufacturers and their beverage cousins. Food was one of the poorest performing sectors in the regions this quarter at a 30 health score, compared to beverages, up to 70, The findings echo the demand for food producers to reduce costs to help combat cost of living, which has reduced the profitability for independent food manufacturers.
UK overstock levels
The long tail of the pandemic is visible in many ways, but for manufacturing leaders in the UK, their acceptance of excess stock has clearly become a fixture of the industry. Overall the overstocking problem has worsened across the board, with average overstock levels climbing to £141,397 in Q3 2023, up from £119,183 in the same quarter last year.
Heavier industries with naturally longer lead times such as building and construction or metal and fabrication have shown themselves to have a far greater appetite for increasing their overstock levels, while many export and retail industries have evidently been more prudent with their inventory control since last year.
Increase
- Building and Construction is facing seriously dangerous overstock levels (£364,502) the highest of any industry, and well over double the average level of £141,397. Although it has dropped slightly from its 2022 heights of £406,769. The overstock levels reflect a sharp decline in projects caused by house-builders and property developers being put off by the high cost of borrowing and economic concerns.
- Metals and Fabrication is also facing high dangerous overstock levels (£325,511), the second highest industry and more than double.
- Cosmetics & Personal Care (£86,602) have seen a steady increase in overstock levels in the last two years. But as overall business health remains positive, and the level is far below average this is less of a concern.
Decrease
- The most drastic drop in overstock levels was seen in Health, Medical Supplies and Equipment, which dropped down to £70,260 in Q3 2023, down from heights of £257,821, reflecting a return to normalcy for an industry that saw significant upheaval during the pandemic.
- Sports, Entertainment and Recreation has made steady efforts in controlling its overstock volume in the past three years, down to £78,335, from £118,079 in 2022, and £157,155 in 2021.
- The Clothing, Footwear and Accessories industry also has also managed to keep its overstock levels low at just £52,475, down from £77,400 in 2021.
UK lead times
Decrease
- Beverages, Office Supplies, and IT Products and Services shared an impressive improvement of lead times down to 14 days in Q3, the lowest of any UK industry and more than a full working week faster than the UK all-industry average of 20 days.
- The Clothing, Footwear and Accessories industry continued post-Covid lead time recovery down to 27 days, down from the soaring heights of 57 days in 2022 when supply chains struggled in the midst of the pandemic.
- Another lead time success story was the Electrical and Electronic Components industry down to 19 days, from 42 in 2022, and 56 days in 2021.
- While Sports, Entertainment, Recreation lead times remain above a week above the all-industry average at 27 days, the figure is an impressive drop from its eye-watering, unsustainable levels of 94 days in the heights of the pandemic in 2021.
- While overall business health and overstock levels have been less than ideal, lead times have decreased for Building and Construction, down to 17 days.
Overall
Overall, UK manufacturers have made an impressive recovery in lead times since the supply chain blow out seen during 2021. The average of 20 days is reflected well across the bulk of UK industries, and is a successful drop of two weeks from the 43 day average of 2022.
The recovery has been more dramatic across those industries that suffered excess strain during the Covid-19 pandemic such as Home Furnishings, Cosmetics & Personal Care, and Sports, Recreation, Entertainment.
This reflects a broad recovery for UK industries, but as supply chains move more freely amidst an economy of households tightening belts, businesses may need to monitor overstock levels so as not to overplay their hand.
Sector performance by country – Australia
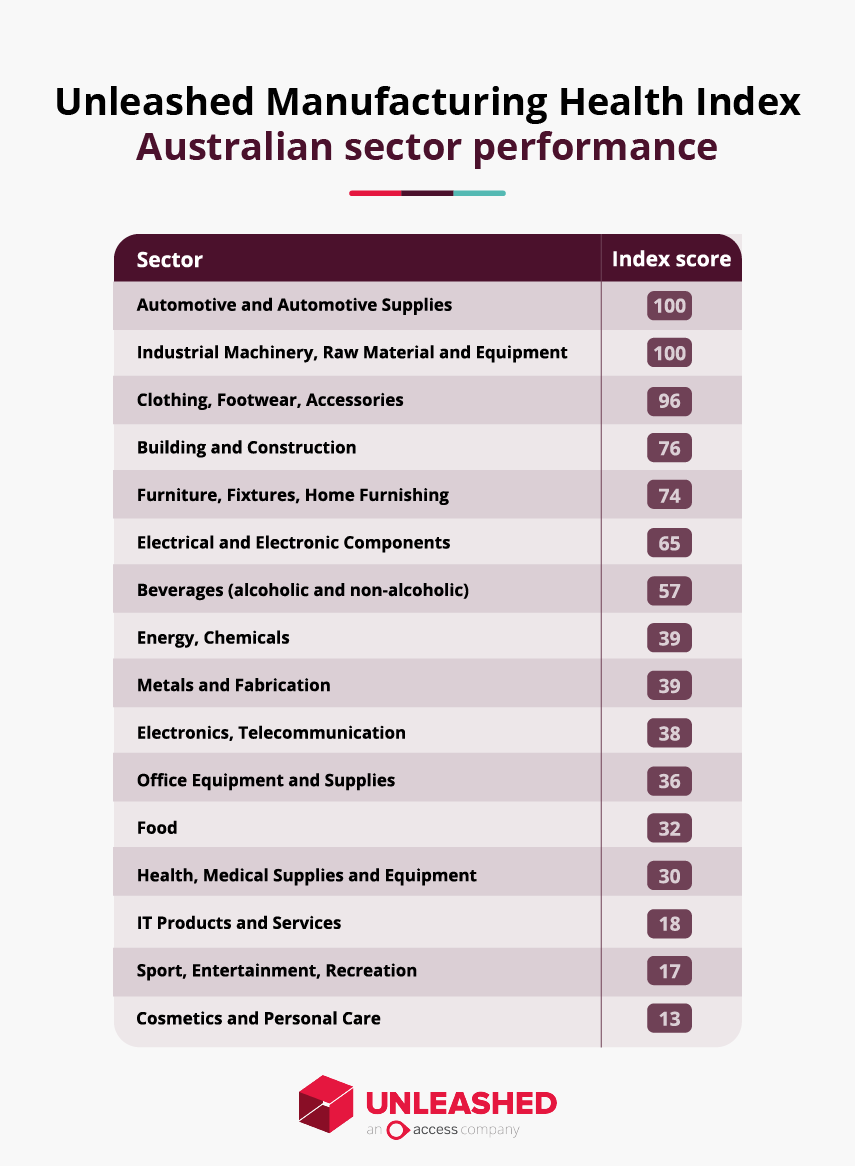
The Australian manufacturing industry is seeing a shrinking middle, with the majority of the 16 industries studied either doing poorly, or doing very well. The beverage sector was the only industry to score between 40 and 60, at 57 out of 100.

Up
- Despite some negative industry sentiment, manufacturers in the building and construction industry saw a positive health score of 76 in Q3, the fourth highest of the 16 industries analysed
- By contrast to New Zealand’s struggling beverage industry and general ‘craft beer recession’ rhetoric, Australian beverage makers are performing above their historic averages, with a 57 point health score. However quarter-on-quarter profitability for the sector is trending down.
- Automotive and industrial machinery manufacturers are the best performers in Australia both taking 100 point health scores.
Down
- Cosmetics & Personal Care manufacturers have run into difficulties, scoring an industry worst 13. By contrast, Cosmetics was the best performing industry segment in New Zealand on the back of two consecutive quarters of strong performance.
- Sports and recreation makers are also doing it tough at 17 out of 100 in Q3.
Australian overstock levels
Overall
- Australian manufacturers have continued to be dangerously overstocked, failing to de-risk following the post-Covid lessening of supply chain pressure. Current average overstock levels are at $259,390 of excess stock per business, up from $244,205 in 2022.
Increase
- Metals and Fabrication is facing dangerous overstock levels ($639,900) the highest of any industry industry average, although it has dropped significantly from the previous year’s figure of $779,349. Combined with the industry’s low profit margins this puts the sector in a dangerous position.
- Office Equipment has also spiked up to $391,709 up from $244,851.
- Only the Beverages industry ($67,886) and Textiles ($88,343) have managed to keep overstock levels under $100,000. All other industries are well above $100k with the average at $259,390.
Decrease
- Health and Medical Supplies have steadily decreased their overstock levels down from the highs of the Covid-19 era. Now down to $159,549, from $237,747 in 2022, and $248,463 in 2021.
- The Textile industry has made considerable headway into controlling its overstock volume over the past three years, down to $88,343, from $111,239 in 2022, and $180,509 in 2021.
Australian lead times
Decrease
- Clothing etc. saw the most impressive improvement in their lead times, from a high across all measured industries of 56 days in 2022, down to 24 days in Q3 2023. Despite the downward trend this is still a working week longer than the all-industry average of 19 days.
- Furniture, Fixtures and Home Furnishing also saw a large drop in lead days falling from a high of 60 in 2021, 53 days in 2022, to 24 in 2023, a steady trend lower.
- Office Equipment and supplies saw the lowest lead times of all industries with an average of 9 days.
- Automotive supplies have been on a steady march downwards from 34 days in 2021, to below the average with 15 days in 2023.
Overall
- Overall, Australian manufacturers have managed an impressive recovery in their lead time performance in Q3 down to 19 days, almost half of the 37 days in 2022, and 40 in 2021. This shows the renewed focus on supply chains over the post-covid era has freed up operations.
Sector performance by country – New Zealand
New Zealand manufacturers have managed to maintain an average performance overall in Q3, scoring 51 out of 100 on the Manufacturing Health Index. At an inflection point in New Zealand with the entrance of a new government, the industry has the potential to head in either direction.
By comparison, New Zealand’s manufacturing contemporaries in Australia are performing well at 63 out of 100, while the UK is at 77 for Q3.

Down
Despite the overall consistent performance of the manufacturing industry, there have been winners and losers at the fringes
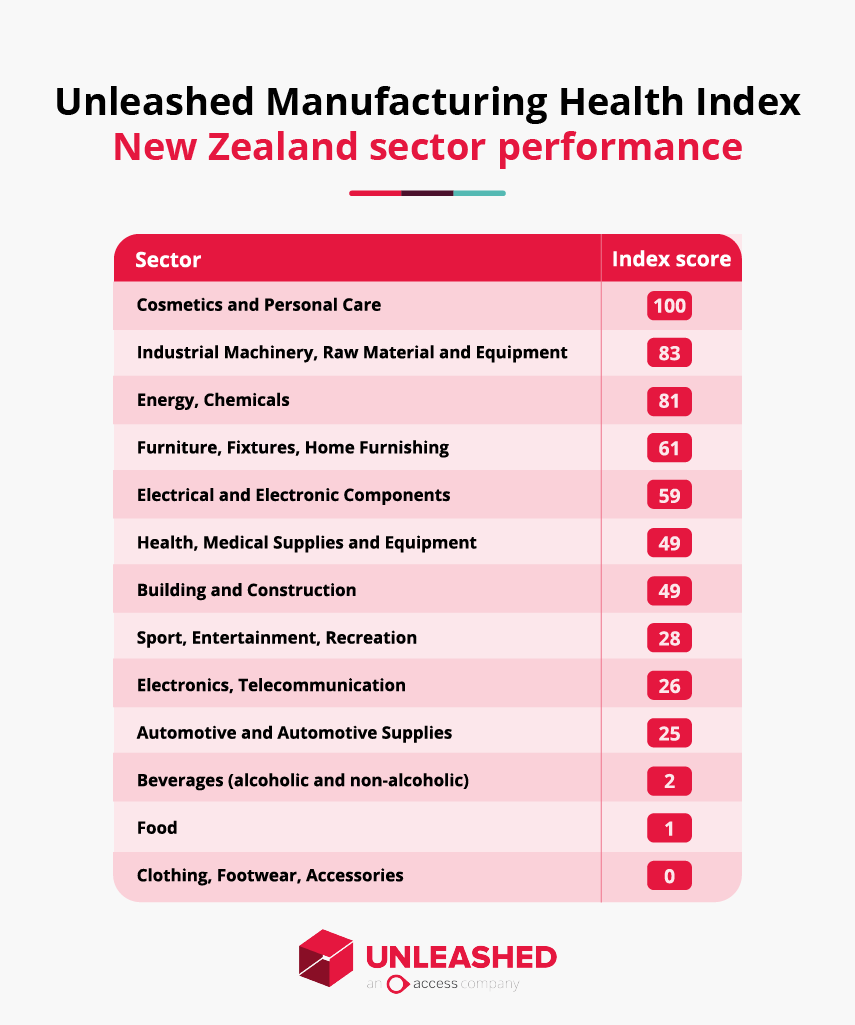
- New Zealand’s food and beverage manufacturers are doing it particularly tough at the moment, scoring 1 and 2 out of 100, respectively – indicating historically low performance since 2021. The news will come as no surprise to New Zealand’s industry, which has been hit hard by shutdowns and restructures.
- Clothing and footwear is also doing it tough, scoring the worst out of the 16 industries researched at 0 out of 100. Again, the news resonates with the sentiment on the ground with many local makers struggling, and a series of high profile businesses forced to close their doors or move their local manufacturing this year.
- Despite negative sentiment about NZ’s construction industry at present, building and construction firms scored 49 out of 100 in Q3, showing stable profitability and general health
Up
- Following a difficult outlook during much of the pandemic, NZ made Cosmetics & Personal Care items are well into the green this quarter, scoring a perfect health score this at 100. By comparison, Australian Cosmetics manufacturers have seen a reversal in their fortunes, scoring a health score of 13, the worst performing of all of the industries across the ditch.
- Local furniture and furnishings manufacturers are also in good health this quarter, scoring 61 out of 100.
NZ overstock levels
Overall
- New Zealand manufacturers have gradually started to shake the hangover of the pandemic with their stock control, holding an average of $155,334 in overstock, down from $166,372 in 2022 and $167,401 in 2021
Increase
- Beverage manufacturers have seen their overstock levels spike each year over the past three years, at $106,180 this year, from $86,167 in 2022, and $72,111 in 2021, defying the trend seen generally across the manufacturing industry
- Automotive supplies has been consistently overstocked the past three years at $246,020 this year, $247,092 in 2022, and $249,745 in 2021
- Sporting goods manufacturers have seen overstock levels rise to $206,373 in Q3 2023, up from $185,712 in 2022, and $141,283 in 2021.
- NZ Construction manufacturers has slowly been getting its overstock levels under control, averaging $185,933 in overstock, down from $268,533 in 2022, and $288,343 in 2021
- The Metal and Fabrication industry has made considerable headway into controlling its overstock volume over the past three years, down to $100,099, from $231,445 in 2022, and in $353,672
NZ lead times
Decrease
- Metal and Fabrication saw the most impressive improvement in their lead times, from a high across all measured industries of 85 days in 2021, 52 in 2022, down to an NZ industry average 20 days in Q3 2023.
- Clothing footwear and accessories has the highest lead time of all measured groups at 29 days, despite improving from 61 days in 2022 (also an industry high), and 49 days in 2021
- The embattled Beverage industry is providing the fastest lead times of group at 13 days on average, down from 21 days in 2022, and 25 days in 2021
Overall
Overall, NZ manufacturers have managed a miraculous recovery in their lead times in Q3 down to 20, less than half of the 41 days in 2022, and 47 in 2021
About Unleashed
Unleashed is cloud-based inventory management software that gives product businesses clarity and control across suppliers, production, inventory and sales. Founded in New Zealand in 2009 it was acquired by the UK’s Access Group in November 2020. With thousands of users in more than 80 countries, it’s one of the most respected names in inventory, manufacturing and product management software worldwide.
